Annual industry report
Artyc

Fifty-five pages. The test was whether you could pull any one of them out of a stack and know where it came from.
Fifty-five pages. The test was whether you could pull any one of them out of a stack and know where it came from.
The short version
Chain Reaction is Artyc's annual report on the cold chain industry. It started as a memo I wrote and pitched to the CEO, and I ran it from there. Research and source auditing, the section architecture, the writing structure, all of the information design and layout, and the launch.
Two editions. 2024 ran 39 pages. 2025 ran 55, across five sections, each with 40+ sources.
One constraint I set for myself was to write about our own industry without naming our own product once.
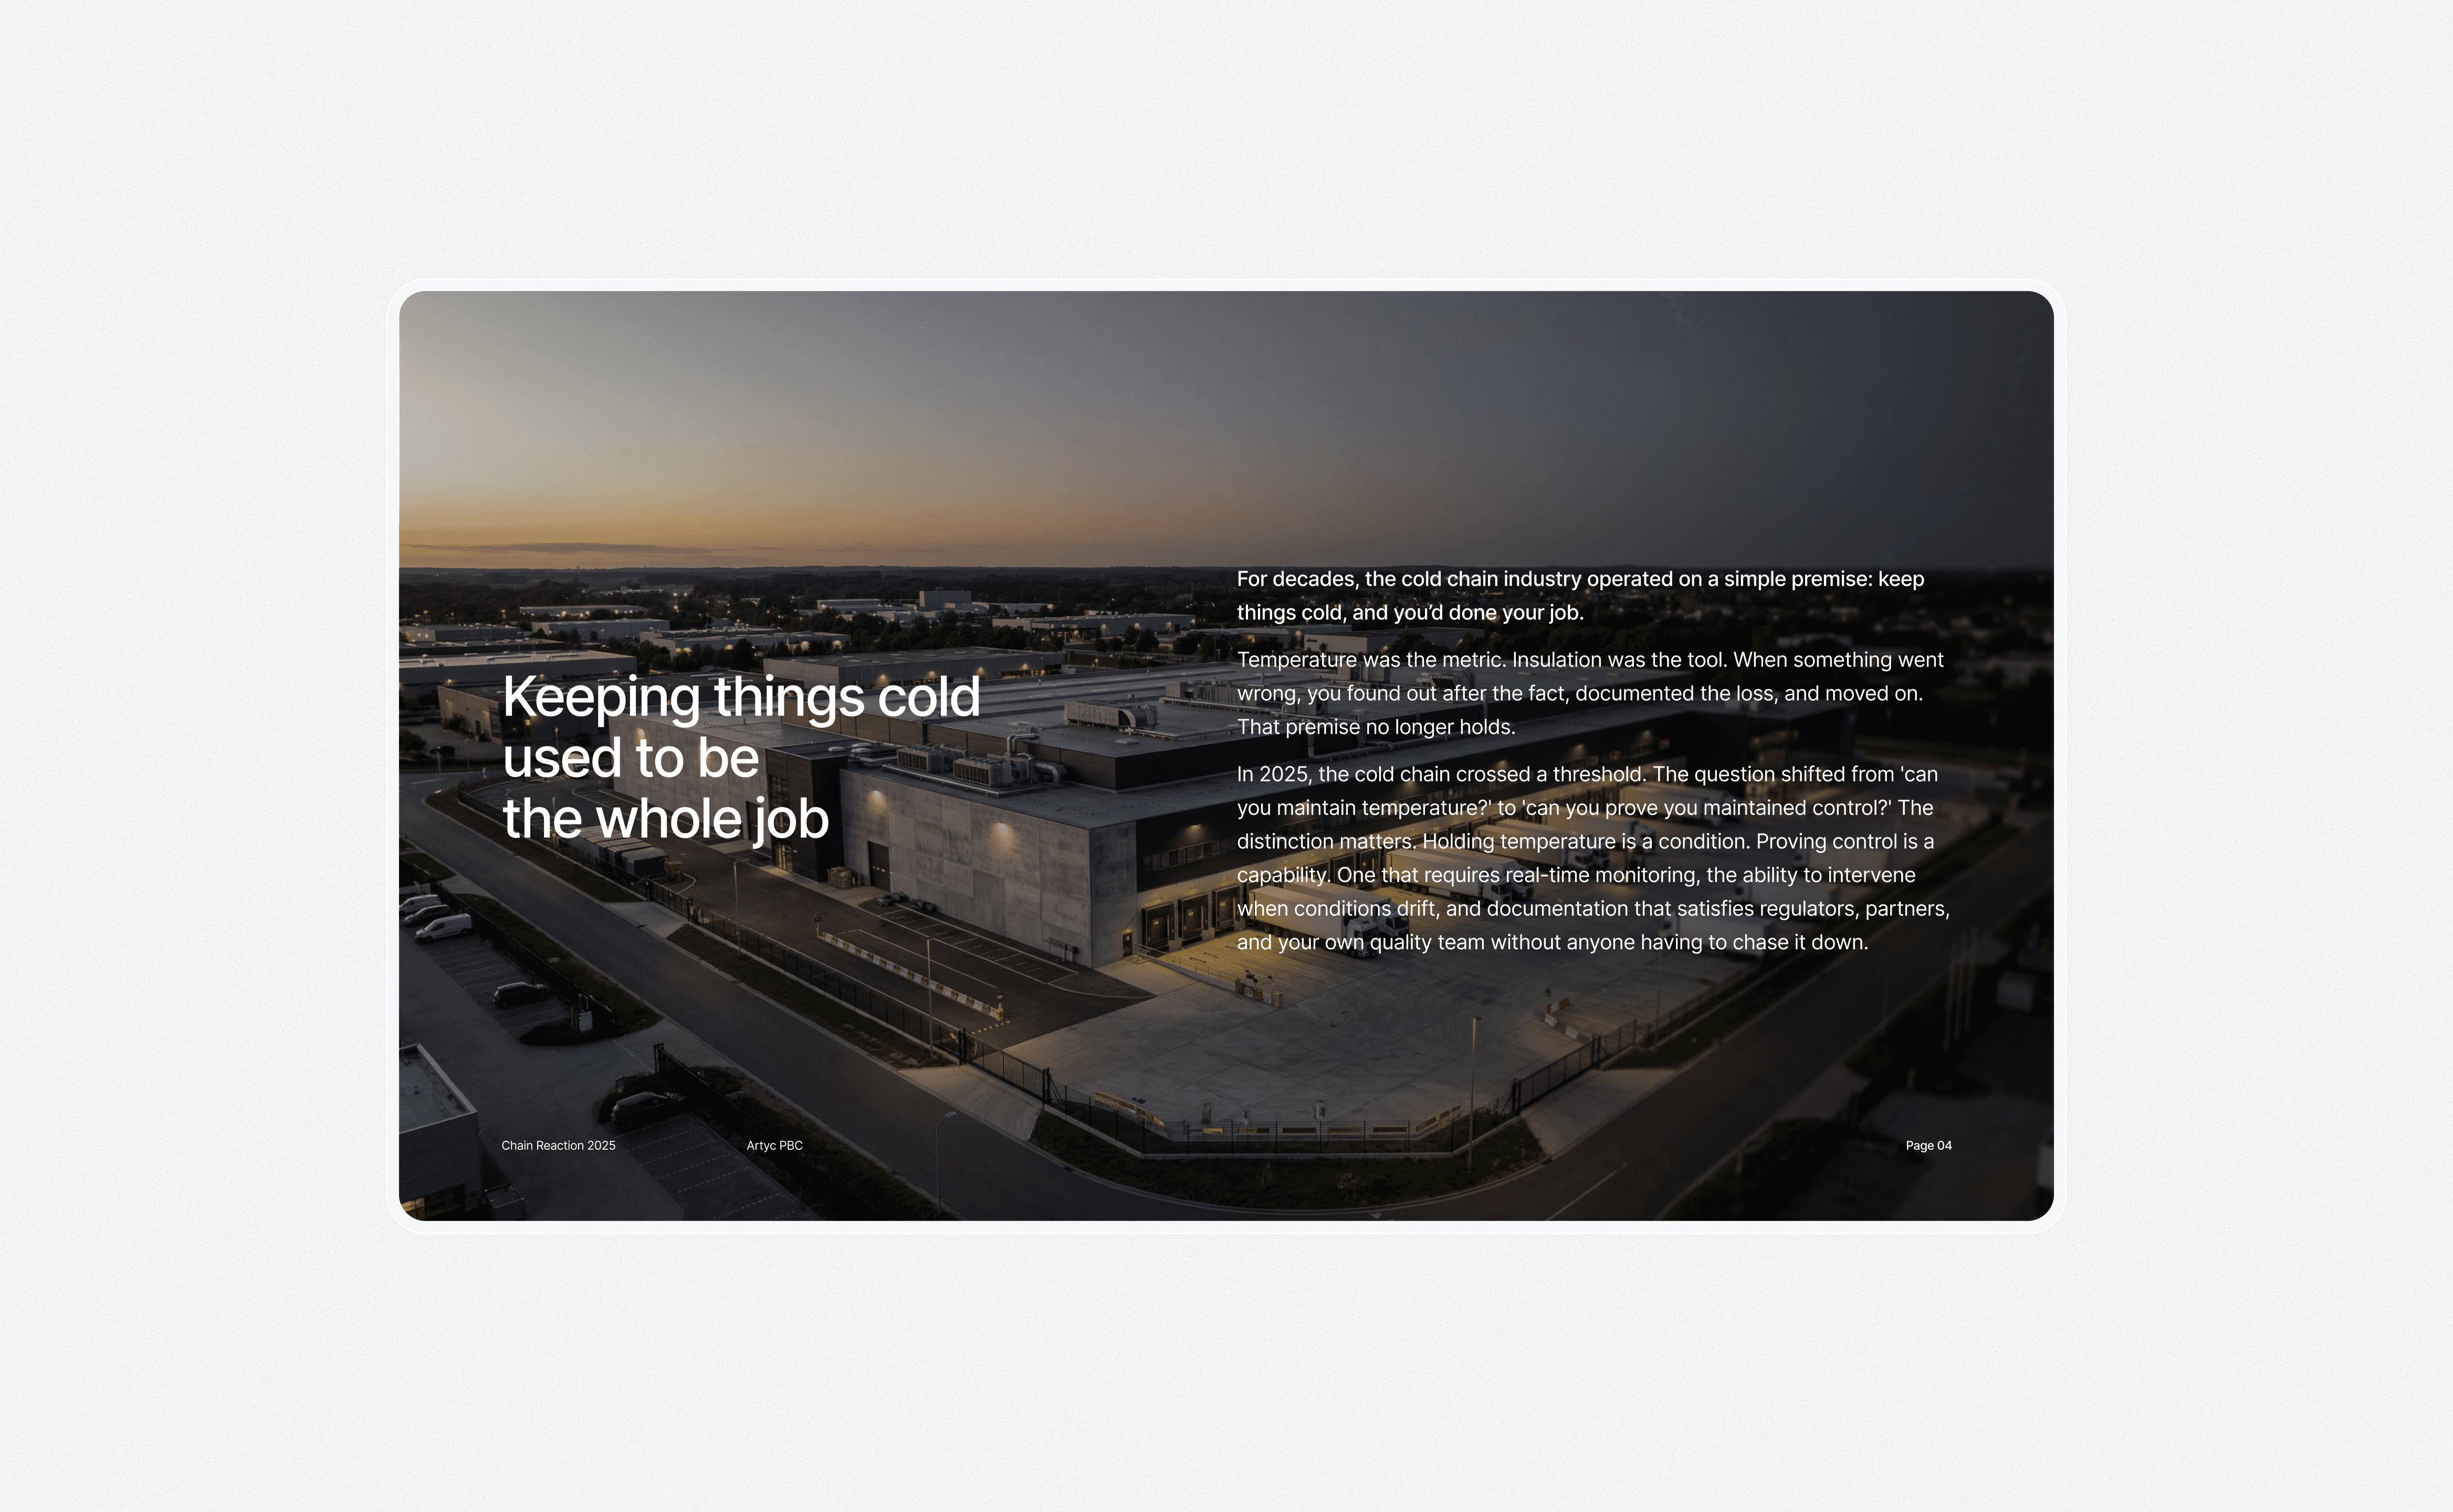
Page four. Everything that followed was an argument that the distinction is real and costs money.
The problem
Cold chain is an industry that publishes a great deal and reads very little of it. Most of what circulates is vendor marketing wearing the costume of research. Things like four trends nobody disputes, a chart with no source, and a product mention on page nine.
Artyc sells into a market dominated by companies that have been in it for decades and have the budgets to match. You cannot outspend them. From a marketing perspective, the only available move is being more useful to the reader than they are.
That created a bind. Artyc sells active cooling, and the question the whole industry argues about is active versus passive. Any report that argues for its publisher's category is an advertisement, and readers can smell it inside a paragraph. So the useful version of this document was one that declined to make the argument the company most wanted made.

The number everyone cites. We kept it and dated it. The fact that nobody has updated it in six years is part of the argument.
The approach
The report needed to work for operators, not just executives. Executive-facing content is built to make someone feel informed. Operator-facing content needs to be useful on a Monday. Those produce very different documents.
One locked thesis, stated on page four. The industry's question had shifted from whether you can maintain temperature to whether you can prove you maintained control. Five sections each advance one step of that argument.
Long documents are not always read linearly. They are skimmed, abandoned, and re-entered, so the callouts have to carry the argument on their own.
The industry's most-quoted figure is $35 billion in annual losses. It is on every conference slide in the category. When I traced it, the number dated to 2019. We printed it with its age attached:
This figure dates to 2019. No one has published an update. That says something too.
An industry that cannot measure its own losses is evidence for the report's entire thesis about visibility. The weakest number in the document became the argument.
Past about page twenty you are no longer designing pages. You are holding consistency across a dozen chart types, several callout treatments, section openers, source citations, and pull quotes. Every inconsistency compounds.
The 2025 edition closes with a scored readiness framework an operator can run against their own network. The sharpest question in it takes ten seconds to fail:
If asked for the chain of custody of your last 100 shipments, could you produce it by end of day?
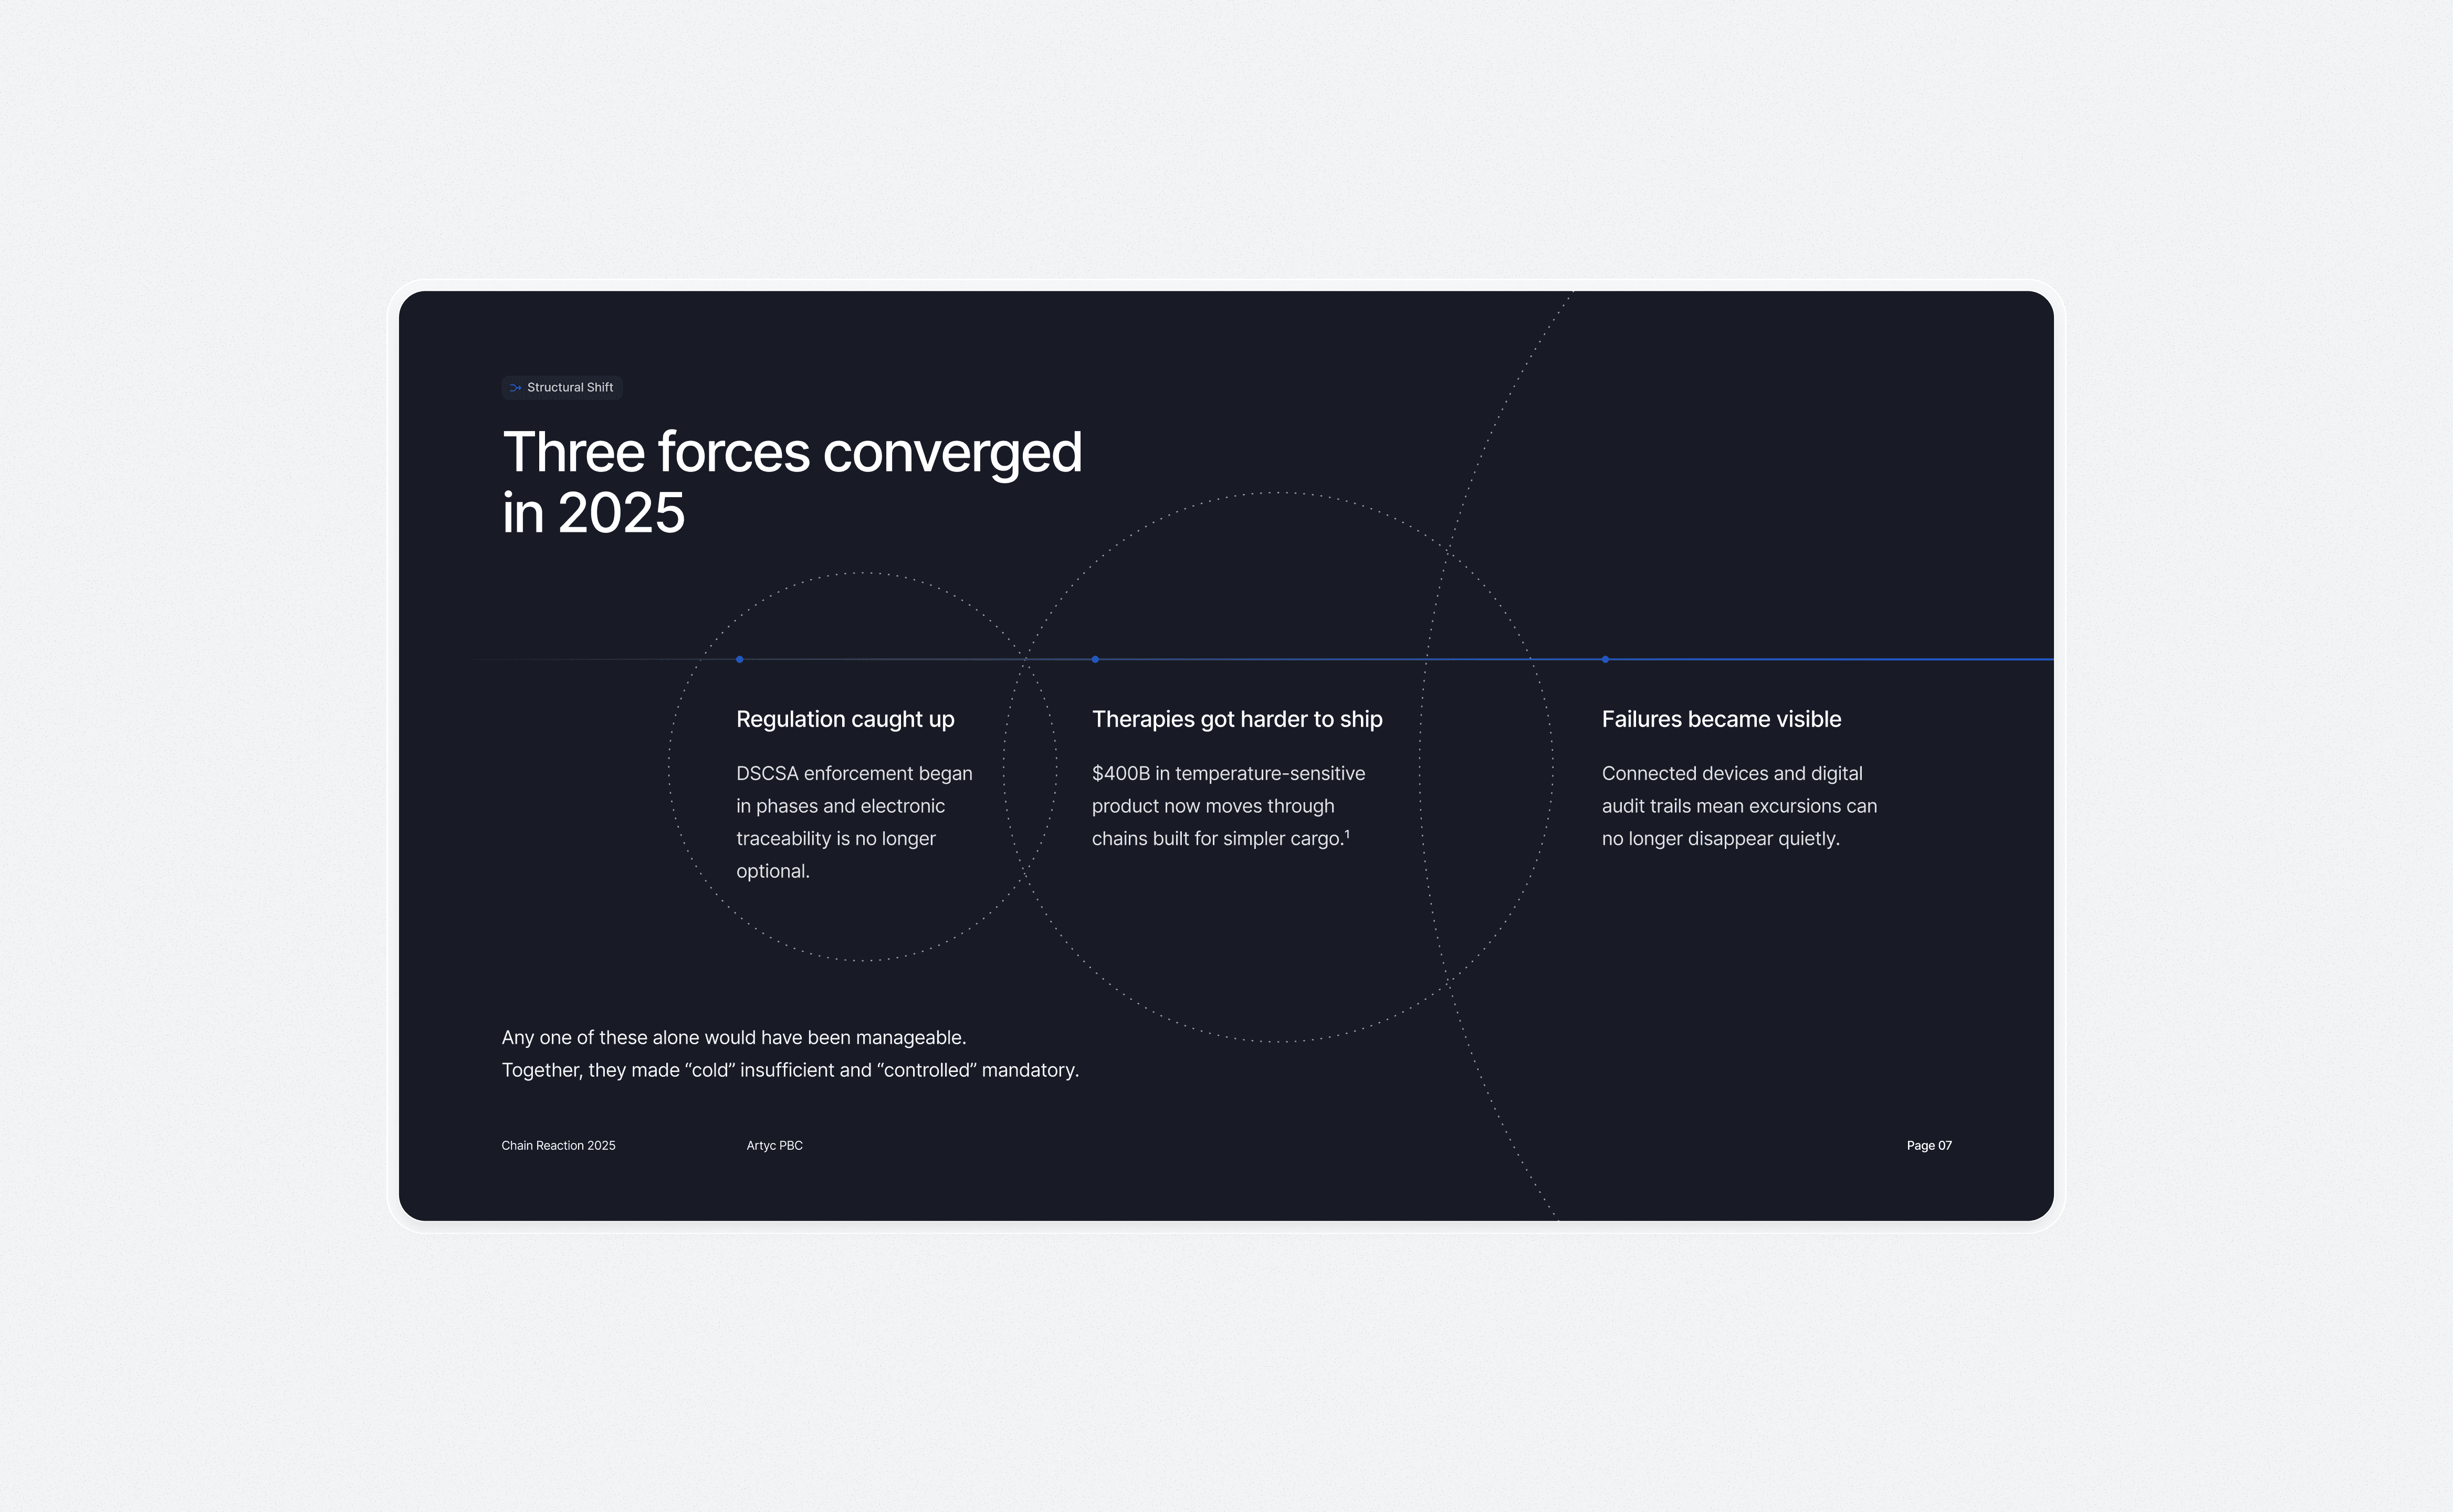
Three forces the industry spent years treating as separate problems. Regulation, product complexity, and visibility.
What landed
Two editions. One for 2024 (39 pages) and one for 2025 (55 pages). Zero product mentions in either.
It became the thing the company pointed at when it needed to be taken seriously by people who had never heard of it. That is a hard position for a 15-person company selling into pharma. The closing line is still the one I would defend:
The cold chains that endure will not just stay cold, they will stay controlled.

The infrastructure argument in one diagram showing how the old hub and spoke model is changing.
What I’d do differently
I underestimated the research load. For the first edition I started from a blank search in the fall and tried to build a year of industry understanding in the couple of months I had to write. Most of the schedule went to finding and verifying sources, which meant layout got compressed at the point where a long document needs the most attention. The last section always got the least design.
For the second edition I moved research out of the writing window entirely. Alerts combing the industry all year, auto-populating a database, each story scored against criteria for whether it was worth keeping. By the time writing started there was a bank to sift through instead of a blank page. The sourcing got better too, because stories were captured when they broke rather than reconstructed months later from whatever was still indexed.
The report is the artifact while the pipeline that feeds it turned out to be the more useful piece of design.
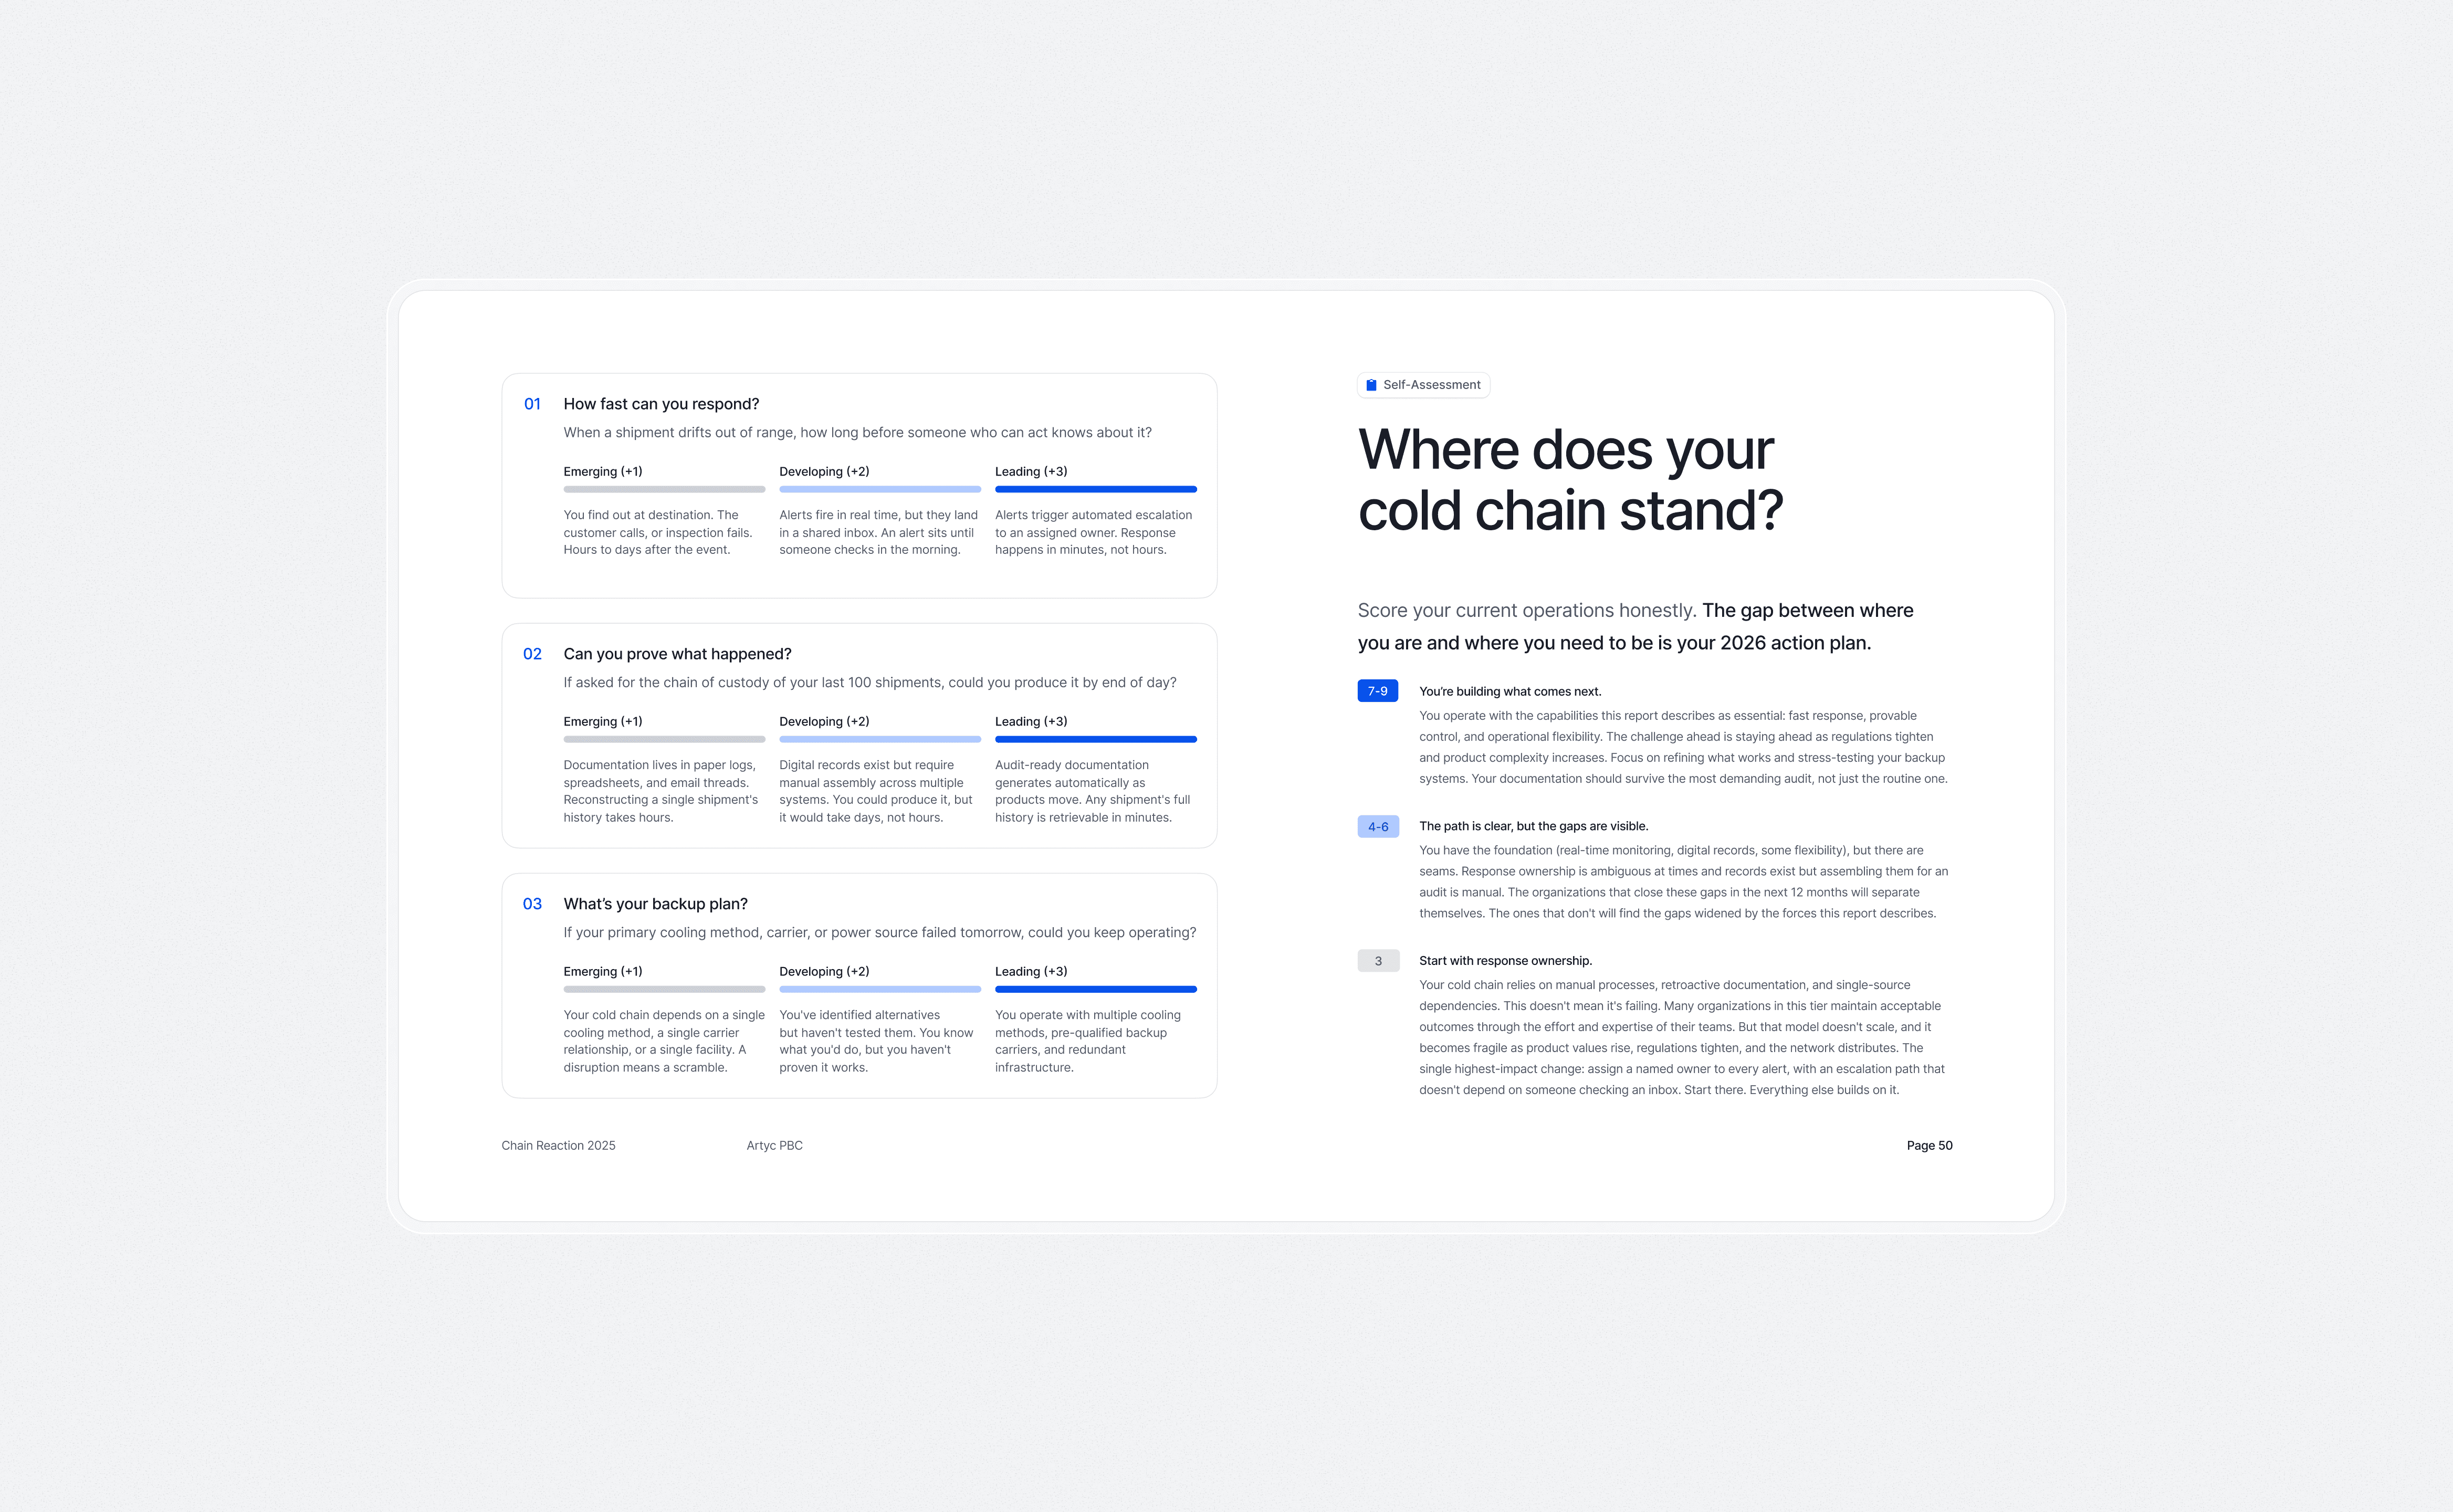
The framework scores against three questions. The second one is the one nobody wants to answer honestly.
What’s still open
Research for a third edition was underway when I left. Whether the pipeline keeps running is the open question.
And I do not know whether anyone used the readiness framework. It was built to be run against a real network, not read. I never found out if it was.
Annual industry report
Artyc
Fifty-five pages. The test was whether you could pull any one of them out of a stack and know where it came from.
Fifty-five pages. The test was whether you could pull any one of them out of a stack and know where it came from.
The short version
Chain Reaction is Artyc's annual report on the cold chain industry. It started as a memo I wrote and pitched to the CEO, and I ran it from there. Research and source auditing, the section architecture, the writing structure, all of the information design and layout, and the launch.
Two editions. 2024 ran 39 pages. 2025 ran 55, across five sections, each with 40+ sources.
One constraint I set for myself was to write about our own industry without naming our own product once.
Page four. Everything that followed was an argument that the distinction is real and costs money.
The problem
Cold chain is an industry that publishes a great deal and reads very little of it. Most of what circulates is vendor marketing wearing the costume of research. Things like four trends nobody disputes, a chart with no source, and a product mention on page nine.
Artyc sells into a market dominated by companies that have been in it for decades and have the budgets to match. You cannot outspend them. From a marketing perspective, the only available move is being more useful to the reader than they are.
That created a bind. Artyc sells active cooling, and the question the whole industry argues about is active versus passive. Any report that argues for its publisher's category is an advertisement, and readers can smell it inside a paragraph. So the useful version of this document was one that declined to make the argument the company most wanted made.
The number everyone cites. We kept it and dated it. The fact that nobody has updated it in six years is part of the argument.
The approach
The report needed to work for operators, not just executives. Executive-facing content is built to make someone feel informed. Operator-facing content needs to be useful on a Monday. Those produce very different documents.
One locked thesis, stated on page four. The industry's question had shifted from whether you can maintain temperature to whether you can prove you maintained control. Five sections each advance one step of that argument.
Long documents are not always read linearly. They are skimmed, abandoned, and re-entered, so the callouts have to carry the argument on their own.
The industry's most-quoted figure is $35 billion in annual losses. It is on every conference slide in the category. When I traced it, the number dated to 2019. We printed it with its age attached:
This figure dates to 2019. No one has published an update. That says something too.
An industry that cannot measure its own losses is evidence for the report's entire thesis about visibility. The weakest number in the document became the argument.
Past about page twenty you are no longer designing pages. You are holding consistency across a dozen chart types, several callout treatments, section openers, source citations, and pull quotes. Every inconsistency compounds.
The 2025 edition closes with a scored readiness framework an operator can run against their own network. The sharpest question in it takes ten seconds to fail:
If asked for the chain of custody of your last 100 shipments, could you produce it by end of day?
Three forces the industry spent years treating as separate problems. Regulation, product complexity, and visibility.
What landed
Two editions. One for 2024 (39 pages) and one for 2025 (55 pages). Zero product mentions in either.
It became the thing the company pointed at when it needed to be taken seriously by people who had never heard of it. That is a hard position for a 15-person company selling into pharma. The closing line is still the one I would defend:
The cold chains that endure will not just stay cold, they will stay controlled.
The infrastructure argument in one diagram showing how the old hub and spoke model is changing.
What I’d do differently
I underestimated the research load. For the first edition I started from a blank search in the fall and tried to build a year of industry understanding in the couple of months I had to write. Most of the schedule went to finding and verifying sources, which meant layout got compressed at the point where a long document needs the most attention. The last section always got the least design.
For the second edition I moved research out of the writing window entirely. Alerts combing the industry all year, auto-populating a database, each story scored against criteria for whether it was worth keeping. By the time writing started there was a bank to sift through instead of a blank page. The sourcing got better too, because stories were captured when they broke rather than reconstructed months later from whatever was still indexed.
The report is the artifact while the pipeline that feeds it turned out to be the more useful piece of design.
The framework scores against three questions. The second one is the one nobody wants to answer honestly.
What’s still open
Research for a third edition was underway when I left. Whether the pipeline keeps running is the open question.
And I do not know whether anyone used the readiness framework. It was built to be run against a real network, not read. I never found out if it was.